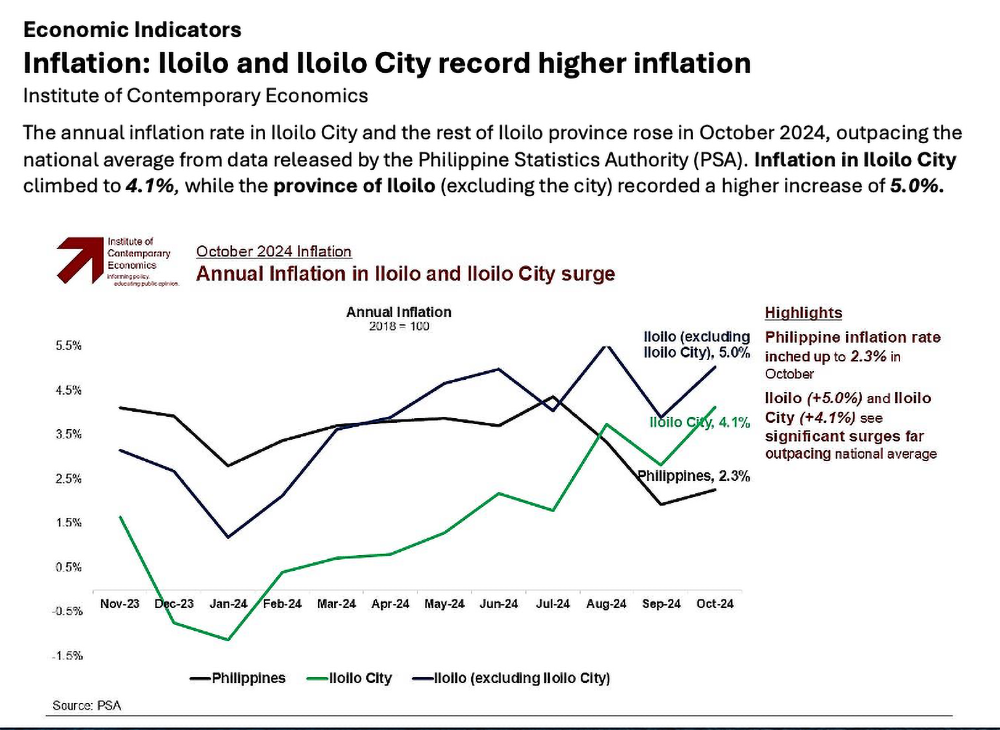
The annual inflation rate in Iloilo City and the rest of Iloilo province rose in October 2024, outpacing the national average from data released by the Philippine Statistics Authority (PSA). Inflation in Iloilo City climbed to 4.1%, while the province of Iloilo (excluding the city) recorded a higher increase of 5.0%.

Philippine annual inflation up slightly to 2..3%
The figures starkly contrast with the national inflation rate, which edged up to 2.3% during the same period from the 1.9% recorded in September. The disparity also highlights a localized economic pressure that residents in Iloilo are facing compared to other parts of the Philippines.
The October data underscored a trend that began earlier this year, marked by fluctuating inflation rates across the country. Iloilo City’s inflation rate began 2024 on a lower trajectory, reflecting a decline from the late 2023 spike when it hovered around 3.5%. The province experienced a similar trend but saw a more pronounced rise starting mid-year, ultimately culminating in the 5.0% rate in October.
By contrast, the national inflation rate demonstrated relatively modest increases throughout the year. The Philippines’ overall rate dipped to nearly 1.5% in the early months of 2024 before gradually climbing to 2.3% by October.
Inflation Drivers
Iloilo (excluding Iloilo City)
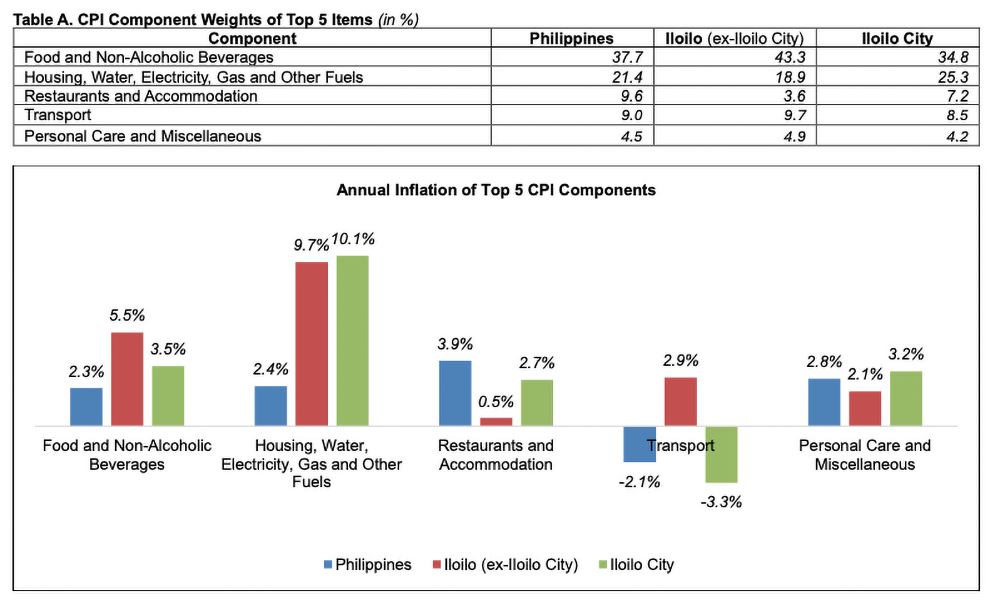
Iloilo Province is inordinately affected by increases in Food and Non-Alcoholic Beverages given that it has a weighting of 43.3% (see Table A) in its Consumer Price Index (CPI) market basket. With this component recording annual inflation of 5.5%, it was the single biggest contributor to inflation in the province accounting for close to half (47.4%) of the inflation for the period. Rice continued to be the biggest culprit with rice prices being 17.6% higher compared to October of last year. Having said that, rice prices seemed to have stabilized and actually fell by 1.3% in October compared to September.
Housing, Water, Electricity, Gas and Other Fuels recorded 9.7% annual inflation making it the largest driver of inflation in absolute terms but given its smaller weighting in the CPI basket contributed less that food to inflation in relative terms. This was driven by electricity prices which were, on average, 30.2% higher compared to last year.
The other major components of the CPI for the province were relatively benign with inflation ranging from a low of 0.5% for Restaurants and Accommodation to a high of 2.9% for Transport.
Iloilo City
In contrast to the province, inflation in Iloilo City was driven mainly by Housing, Water, Electricity, Gas and Other Fuels which rose 10.1%. While electricity prices were higher 17.8% compared to October of last year, its stand-alone impact is muted by the fact that it only accounts for 5.2% of the CPI basket. The abrupt rise in actual rentals for housing was the single largest contributor to inflation for Iloilo City in October. It rose 8.4% compared to October last year and its impact on inflation was compounded by it accounting for 16.7% of the CPI basket. As a result, 34% of the 4.1% inflation of Iloilo City can be directed attributed to the rise in residential rents.
Food and Non-Alcoholic Beverages rose by 3.5% year-on-year. This made this the second-largest driver of inflation in the city. However, food prices have been relatively stable for the past 3 months and if maintained, should provide a cushion for changes in Iloilo City’s CPI.

Current Inflationary Pressures
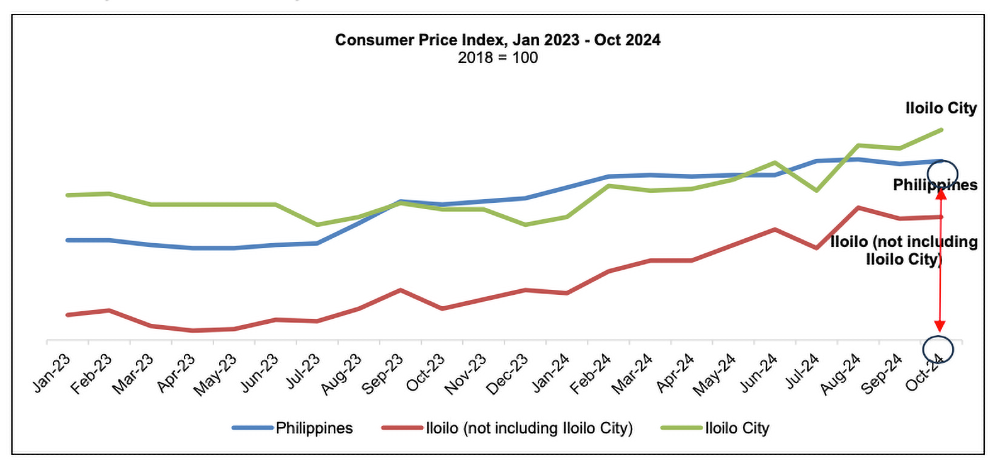
Looking at the Consumer Price Indices for the country as a whole and comparing this with that of Iloilo City and the Province of Iloilo provides insight into possible localized inflationary pressures. For the past 12 months, the CPIs of the city and the province have closely tracked each other. This reflects the common underlying impact of rising food and energy prices. While both remain close to their highs since the start of the year, they have largely stabilized.
We have, however, detected a seeming decoupling (see chart below) in the behavior of the CPIs of the province and the city. Whereas the CPI (i.e. prices) for the province remained largely unchanged (+0.1%) between the months of September and October, the CPI for the city rose +0.9% between September and October. This points to an underlying variable causing the deviation between the city and the province.
We have traced this to the increase in actual rentals for housing which rose 2.5% in the city and remained unchanged in the province. Ordinarily, any rise in housing rents would be demand driven and happens over a period of time, not over a singular month. As this is likely to be a permanent increase (i.e. housing rental rates rarely decrease in a period of sustained demand), this will remain a fixture in the city’s CPI going forward.
The best-case scenario is for prices of the city’s non-core CPI items such as food, to decrease in order to contain the impact of the property cost increase. Absent monetary tools (e.g. BSP’s interest rate mechanisms), local governments have limited ability to contain localized inflationary pressures. This is something that bears watching.
